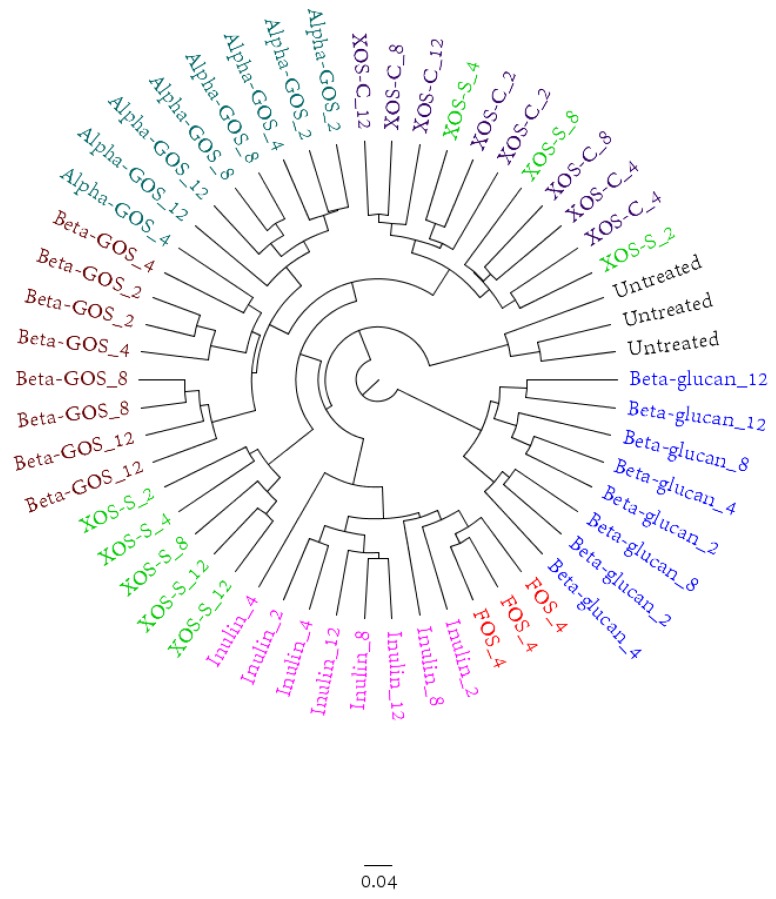
Figure 2.
Clustering tree based on the Bray-Curtis dissimilarity of microbiota composition data, assessed by 16S rRNA gene amplicon sequencing. The number after the fiber indicates the concentration (in mg/mL) at which the fiber was added to the fermentation medium. The fiber concentration of 0.5 mg/mL is not depicted.

