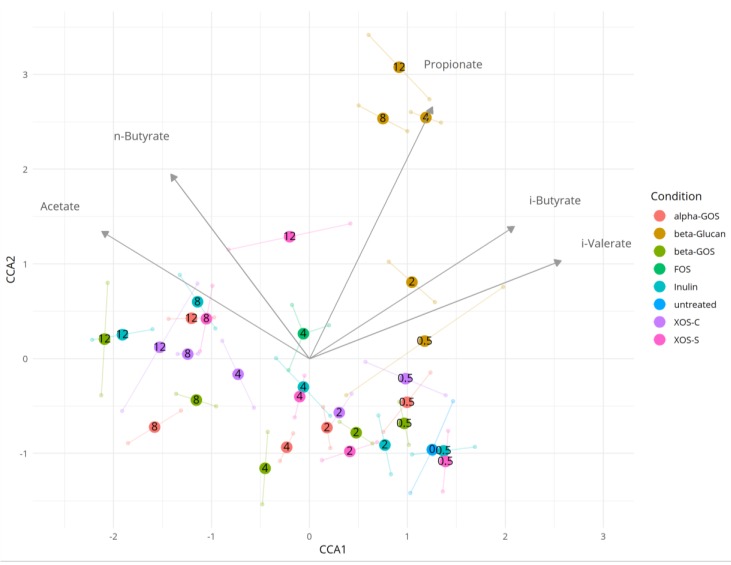
Figure 5.
Relationship between the composition of the microbiota and the levels of short-chain fatty acids (SCFAs), using correspondence analysis. The larger dots represent microbiome composition and show the centroid values for each of the sets of duplicate samples. Arrows represent the direction of the association of microbiome composition with specific SCFA levels.

