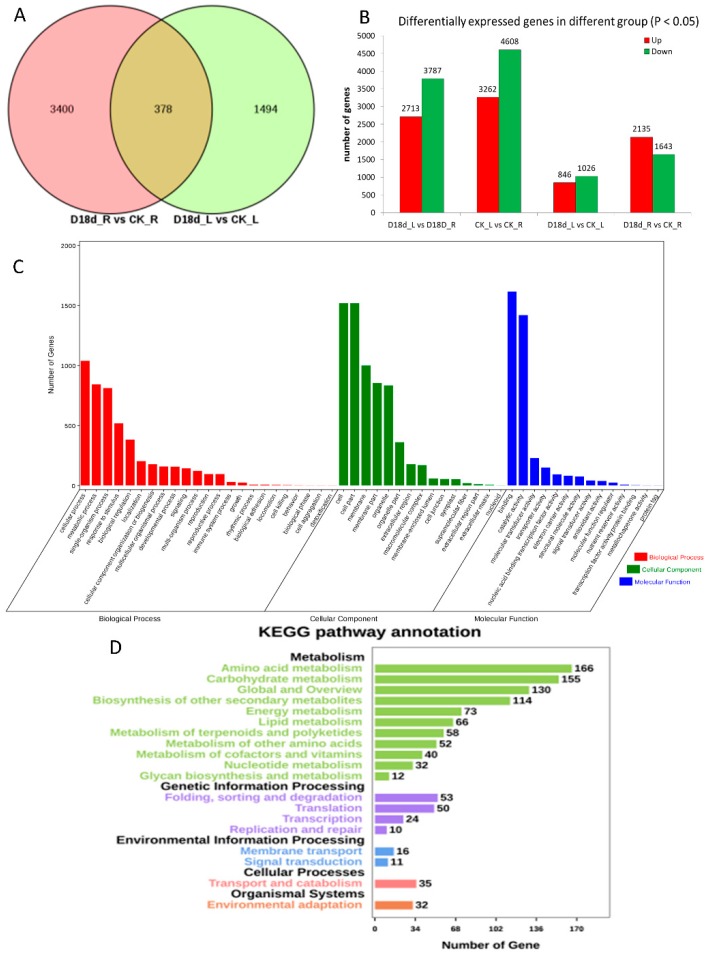
Figure 1.
Differentially expressed genes (DEGs) in orchardgrass treated with drought stress. (A) Venn diagram of DEGs from root and leaf after drought treatment; pink color represent to comparison of drought treat root to controlled root, light-yellow color represent to comparison of drought treat leaf to controlled leaf; (B) column graph of DEGs in different treatment groups showing both upregulated and downregulated genes; (C) gene ontology annotation for all 5272 DEGs; (D) Kyoto encyclopedia of genes and genomes pathway annotation for all 5272 DEGs.

