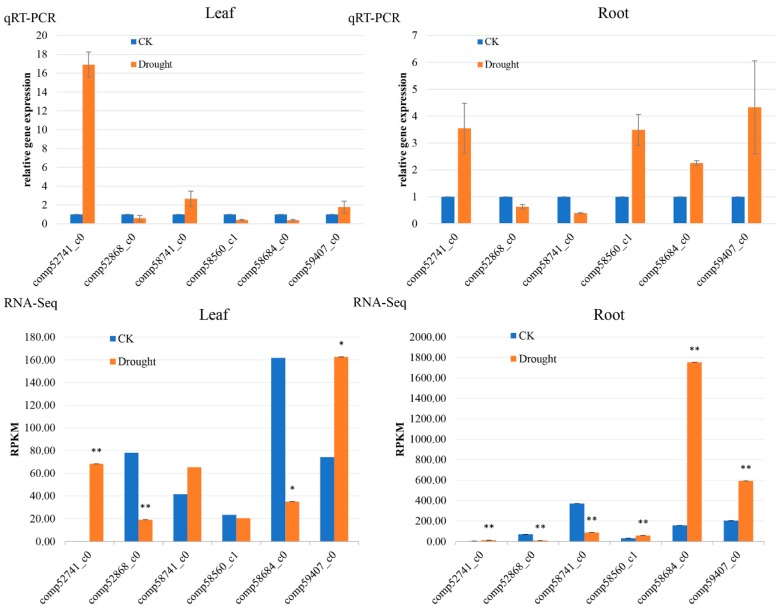
Figure 2.
qRT-PCR verification of RNA-Seq analysis of gene expression. Blue columns stand for control treatment, and orange columns stand for drought treatment. qRT-PCR: Quantitative real time polymerase chain reaction; CK: controlled samples; Drought: drought treated samples; RPKM: Reads Per Kilobase per Million mapped read. * p < 0.05; ** p < 0.01.

