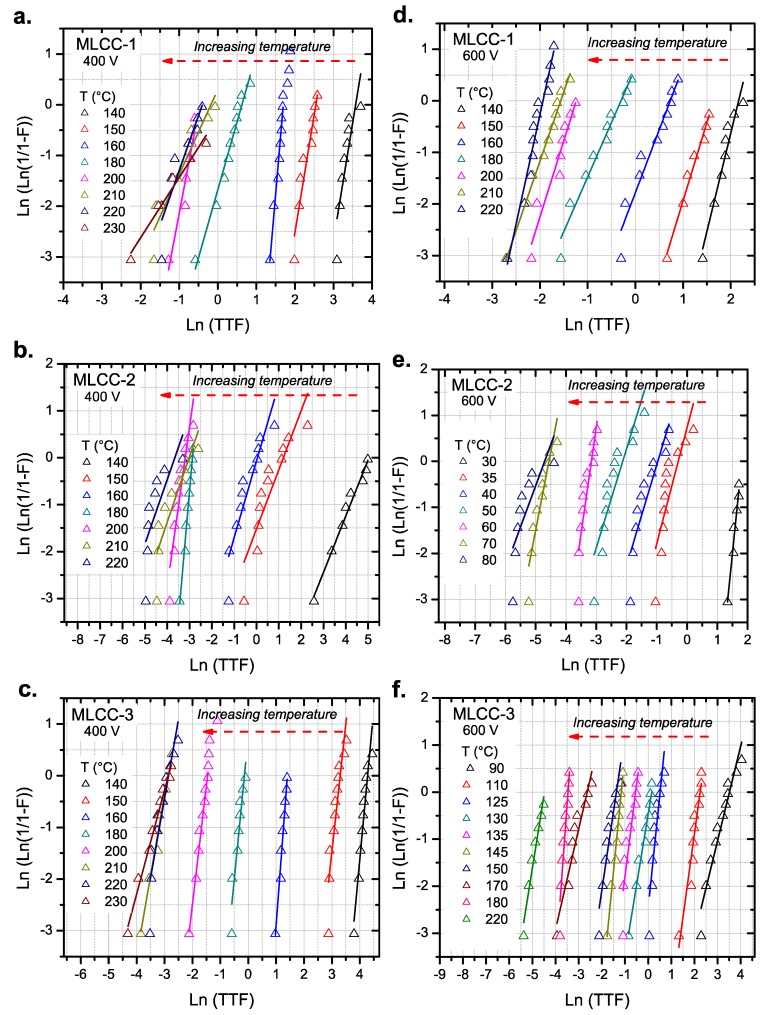
Figure 9.
Weibull plot for MLCCs tested under a wide range of temperatures and different electrical stresses: (a), (b), and (c) 400 V; (d), (e), and (f) 600 V. Lines correspond to the linear fit used to determine the scale parameter (α) of the Weibull distribution. The increase of the temperature shifts the dielectric breakdown of the sample to lower times-to-failure.

