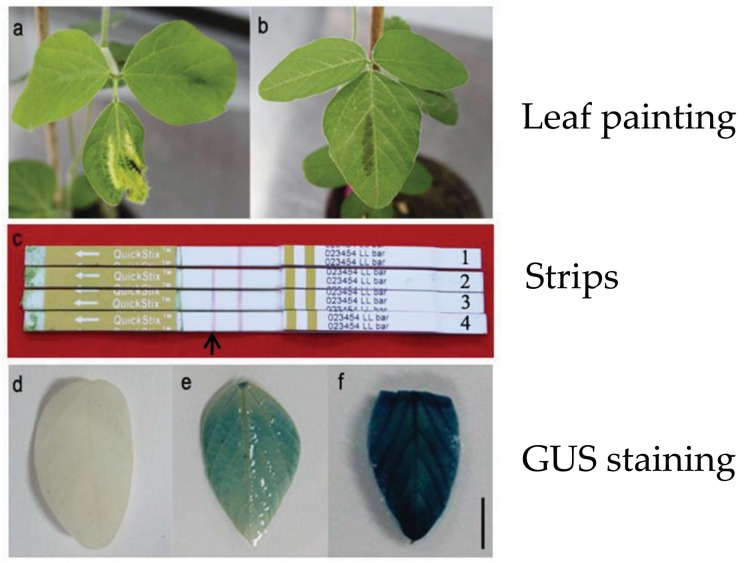
Figure 2.
Detection of transgenic plants. (a) Negative plants by leaf painting; (b) Positive plants by leaf painting; (c) Strips detection: 1 Negative plant, 2–4 Positive plants, the bands at black arrowhead indicate that bar is positive; (d) Negative plants by GUS staining;(e,f) Positive plants by GUS staining. Scale bar, 1 cm.

