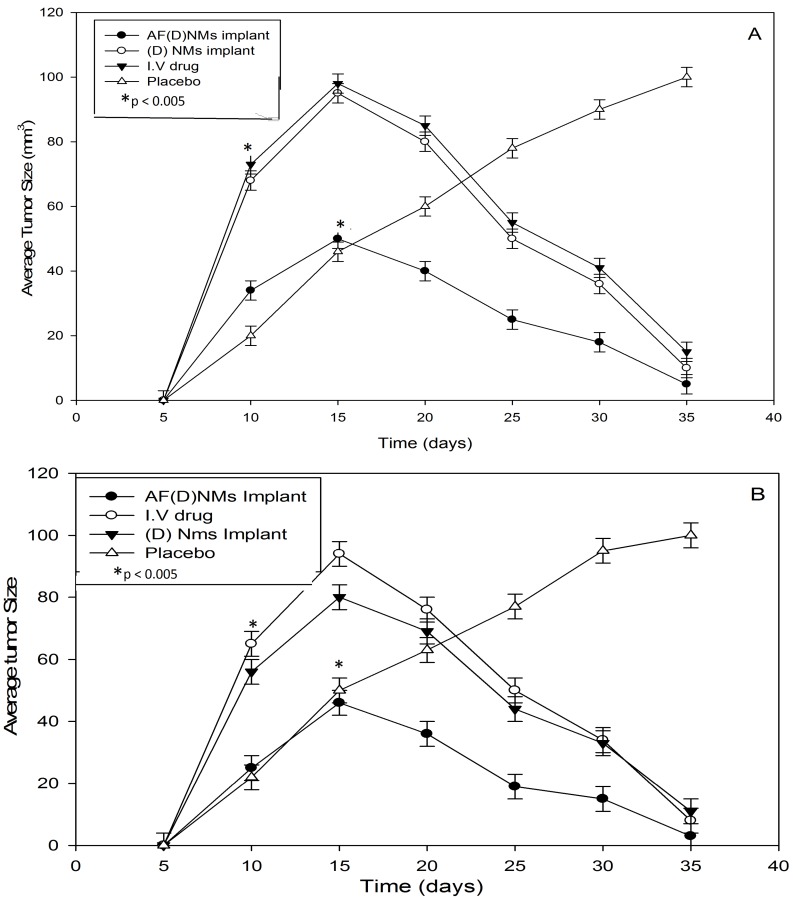
Figure 7.
Nude mouse IP-tumor growth curves illustrating chemotherapeutic efficacy of the three treatment groups vs. the control/placebo group, expressed as average tumor sizes in NIH:OVCAR-5 EOC-bearing nude mice. (A) refers to the methotrexate and (B) the cisplatin-loaded nanomicelle implant delivery system in NIH:OVCAR-5 EOC-bearing nude mice. Each point depicts mean (n = 10/group); bar, ±SD. * p < 0.005 by t-test.

