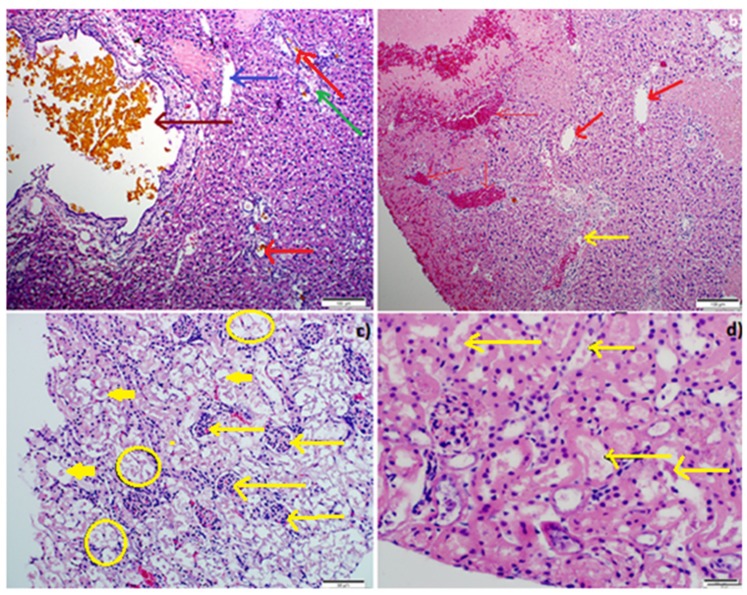
Figure 9.
Microscopic view of the liver (a,b) (scale bar: 100 µm) and kidney (c,d) (scale bar: 50 µm) in IP-AF(D)NMs, IP-(D)NMs and IV-drug only treatment groups, stained with H and E. (a) Cystic distension of bile ductule containing bile (dark brown thick arrows), foci of hepatocellular necrosis (dark blue arrow), mild bile ductule proliferation (red arrows), and mild lymphocytic infiltration into portal areas (green arrow); (b) multifocal to coalescing hepatocellular coagulative necrosis with (red thin arrows) or without associated haemorrhage (red thick arrows) which infiltrated with heterophils (yellow arrow); (c) severe nephrosis as evidenced by ragged intraluminal clumps of cell debris (yellow rings), inflamed cells (thick short yellow arrows), thin long yellow arrows denote clusters of heterophils HE; and (d) basophilic (calcified), granular intra-tubular cellular detritus (yellow arrow), multifocal (segmental) karyolysis in some tubular epithelial cells, and multifocal mild distension of proximal convoluted tubular lumens (lined by slightly attenuated epithelium), HE (Hematoxylin and Eosin staining).

