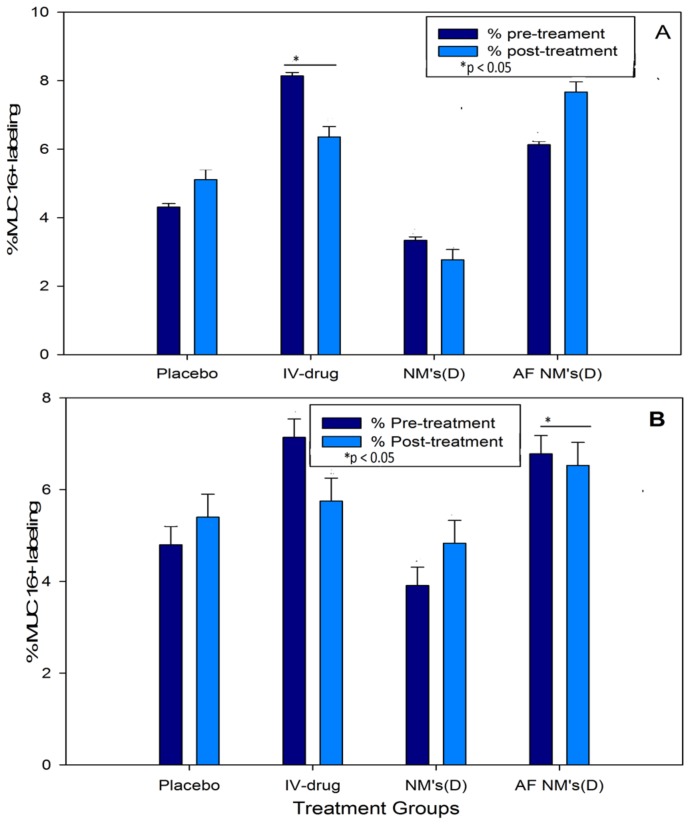
Figure 11.
ROI (regions of interest) measurement of IHC images on the stained slides for each treatment group; the MUC16 density in each image was calculated as percentage of MUC16-positive labeling per square centimeter of each selected EOC tissue section (one per mouse). (D) refers to methotrexate (A) and cisplatin (B). * p < 0.05 by t-test.

