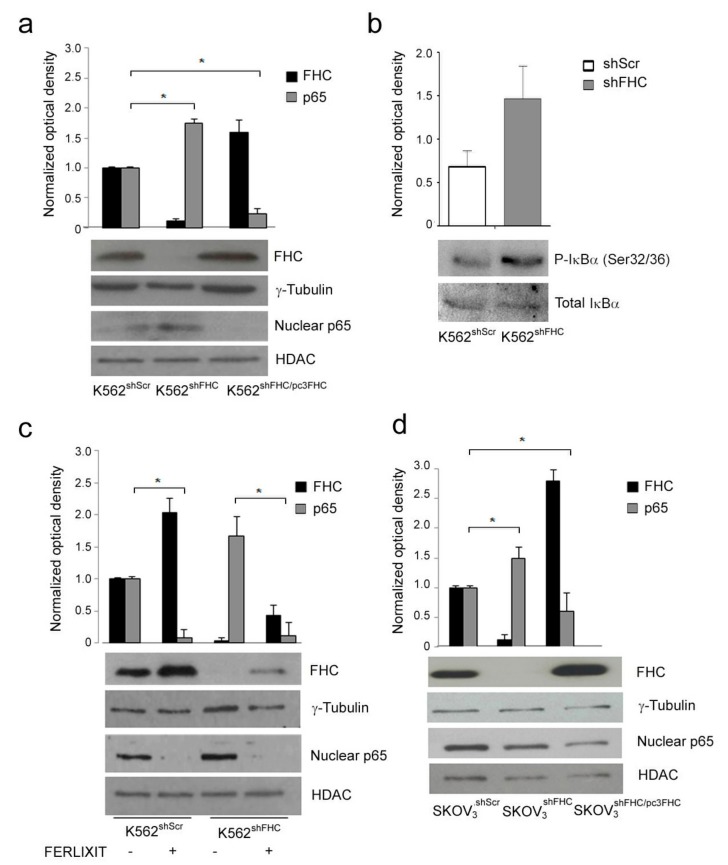
Figure 1.
Western Blot analysis of Ferritin Heavy Chain (FHC) and nuclear p65 expression in K562 and SKOV3 cell lines. (a) Western Blot analysis of FHC and nuclear p65 expression in K562shScr, K562shFHC and K562shFHC/pcFHC cells. (b) Western Blot analysis of phospho-IκBα S32/36 in K562shScr and K562shFHC cells. (c) Western Blot analysis for FHC and nuclear p65 expression upon Ferlixit® treatment of K562shScr and K562shFHC cells. (d) Western Blot analysis of FHC and nuclear p65 expression in SKOV3shScr, SKOV3shFHC and SKOV3shFHC/pcFHC cells. For all panels, FHC expression analysis was performed on 40 µg of total protein, while nuclear p65 expression was performed on 40 µg of nuclear protein extracts. γ-Tubulin, IκBα and HDAC were used as loading control for total or nuclear protein levels, respectively. Blots are representative of three independent experiments. The graph represents the mean of the optical densities (* p < 0.05).

