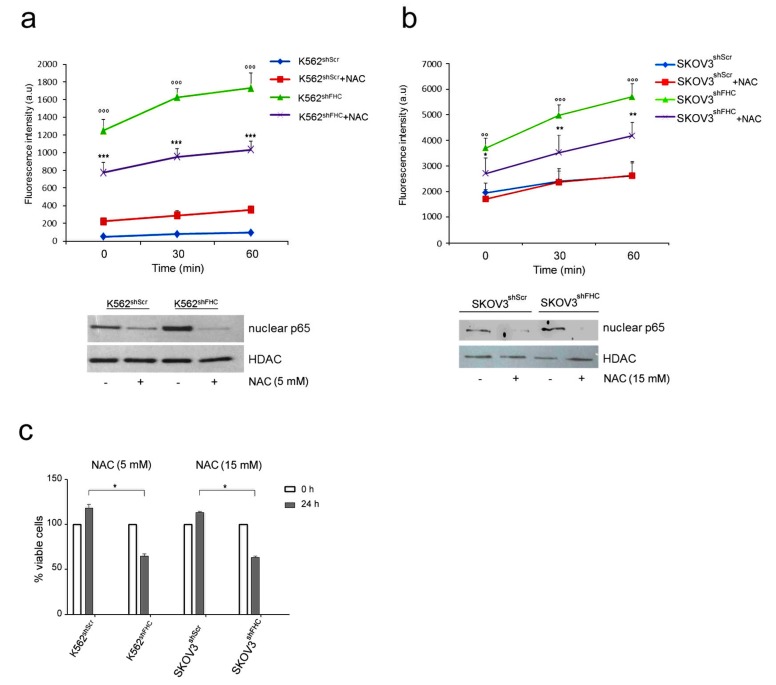
Figure 2.
Reactive oxygen species (ROS) levels and p65 expression in K562 cells after treatment with NAC. (a) Upper panel: ROS analysis of K562shScr and K562shFHC cells. Cells (106) were treated with N-Acetyl-l-cysteine (NAC, 5 mM) for 1 h, incubated for 15 min with 20 µM of 2′-7′-dichlorofluorescein diacetate (DCF) and washed with Hanks’ Balanced Salt solution (HBSS). Fluorescence was measured using the Victor3 Multilabel Counter at 0, 30 and 60 min. The assay was performed in triplicate and data are represented as mean ± Standard Deviation (SD); (*** p < 0.001, compared with K562shScr, °°° p < 0.001, compared to K562shFHC); lower panel: Western Blot analysis for p65 expression, HDAC protein level was used as loading control. (b) Upper panel: ROS analysis of SKOV3shScr and SKOV3shFHC cells. Cells (106) were treated with NAC (15 mM) for 15 min, incubated for 15 min with 20 µM of 2′-7′-DCF and washed with HBSS solution. Fluorescence was measured using the Victor3 Multilabel Counter at T0, T30 and T60 min. The assay was performed in triplicate and data are represented as mean ± SD; (* p < 0.05, compared with SKOV3shScr, ** p < 0.01, compared with SKOV3shScr, °° p < 0.01, compared to SKOV3shFHC, °°° p < 0.001, compared to SKOV3shFHC); lower panel: Western Blot analysis for p65 expression, HDAC was used as loading control. (c) Cell viability of K562 and SKOV3 cells treated with NAC for 24 h. K562 cells were treated at final concentration of 5 mM; SKOV3 cells were treated at final concentration of 15 mM. Cells viability was assayed by Trypan blue exclusion in triplicate and data are represented as mean ± SD; (* p < 0.05, compared with K562shScr and SKOV3shScr).

