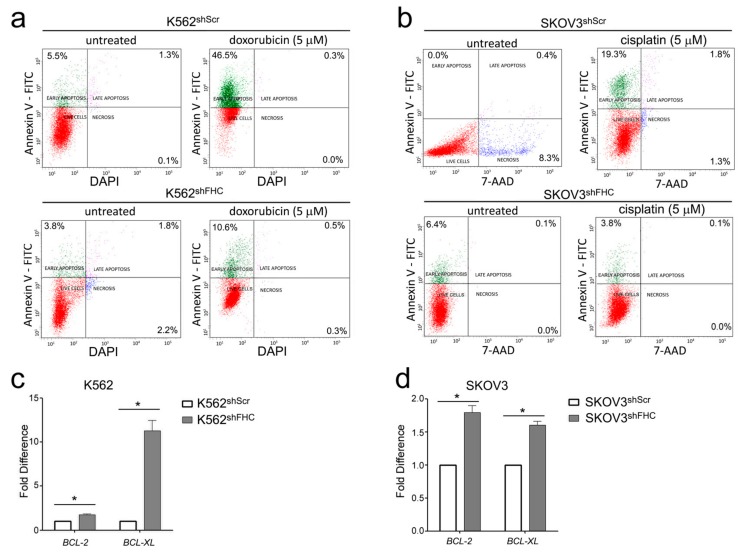
Figure 5.
(a) Representative plots of Annexin V/DAPI apoptosis assays in K562shScr and K562shFHC. (b) Representative plots of Annexin V/7-AAD apoptosis assays in SKOV3shScr and SKOV3shFHC. Fluorescence-activated cell sorting (FACS) analysis was performed on three independent biological replicates. (c,d) Real-time PCR analysis of BCL-2 and BCL-xL mRNAs expression were performed on total RNA extracted from K562shScr, K562shFHC, SKOV3shScr, and SKOV3shFHC cells. Final results represent mean ± SD of three independent experiments. Statistical significance was evaluated by student t-test (* p < 0.05).

