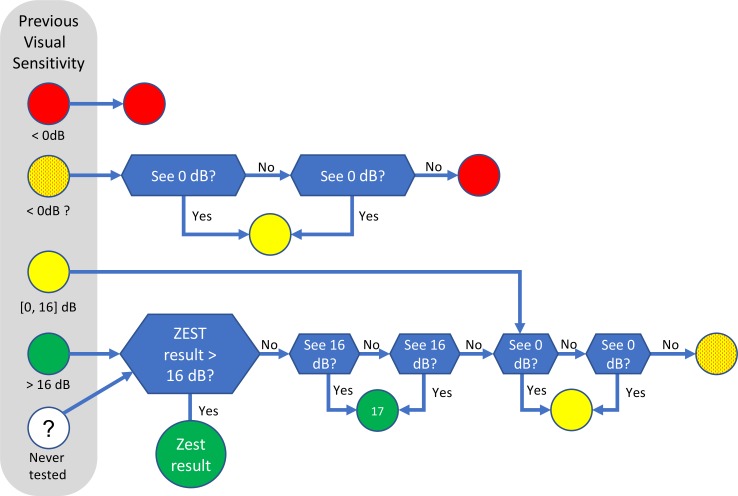
Figure 1.
Actions taken for an individual location based on its previous measured visual sensitivity in the ARREST procedure. Green indicates that the measured visual sensitivity is not ≤16 dB; yellow, in the range 0 to 16 dB; yellow-with-red-dots, in the range 0 to 16 dB but 0 dB has not been seen at least once in the previous test; red, unable to see 0 dB. The white circle indicates that there is no previous visual sensitivity measured for this location. Blue decision boxes indicate that presentations are made and responses gathered.

