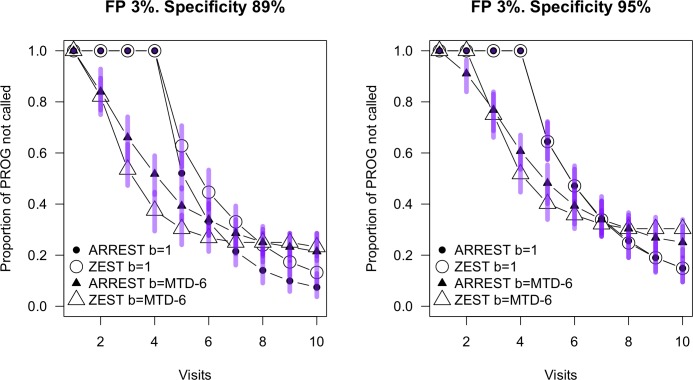
Figure 7.
Survival curves for ARREST and ZEST on the PROG dataset. Progression criteria are as described in Table 1. Circles are for progression from normal (TD = 0, or “b = 1”), and triangles are for the progression from a baseline of mean TD less than −6 (“b=MTD-6”). Specificity was determined on the STABLE-1 and STABLE-6 datasets respectively. Bars show the 95% range over the 100 retests of the same population at each visit.

