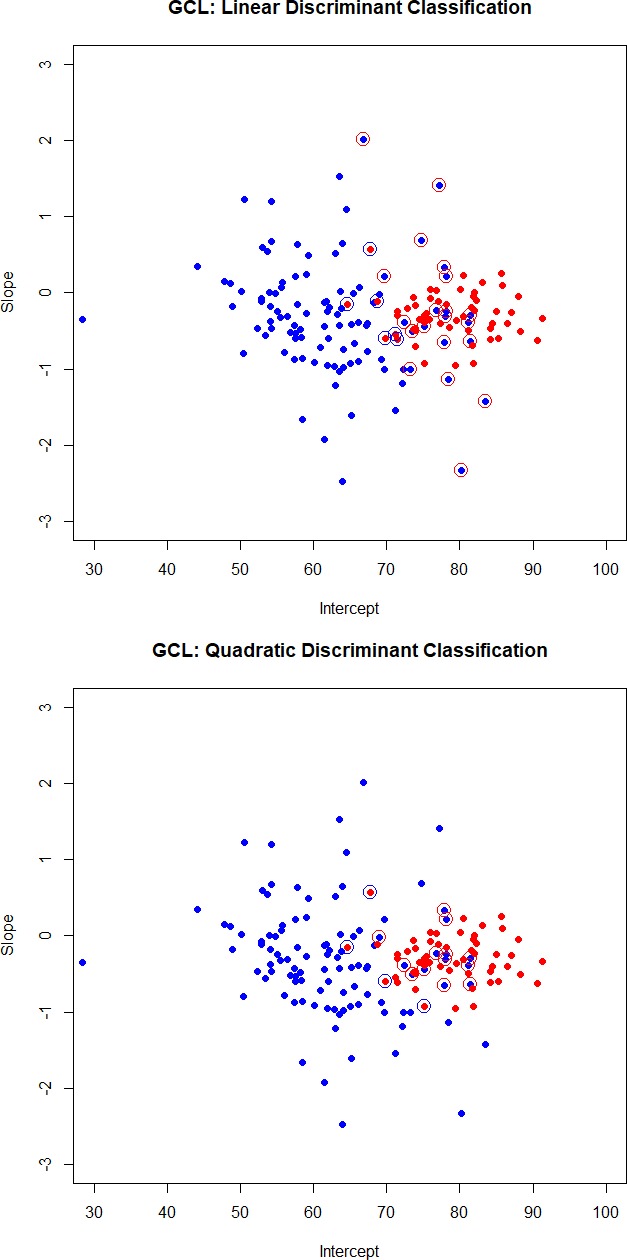
Figure 1.

Scatter plots of intercepts and slopes for GCL. Normal subjects are shown as red dots and glaucoma subjects are shown as blue dots. Subjects that are misclassified by the linear (quadratic) discriminant function are displayed with an open circle in a color that reflects the incorrect classification. A red dot with a blue circle indicates a normal subject incorrectly classified as coming from the glaucoma group. A blue dot with a red circle indicates a glaucoma patient incorrectly classified as coming from the normal group.
