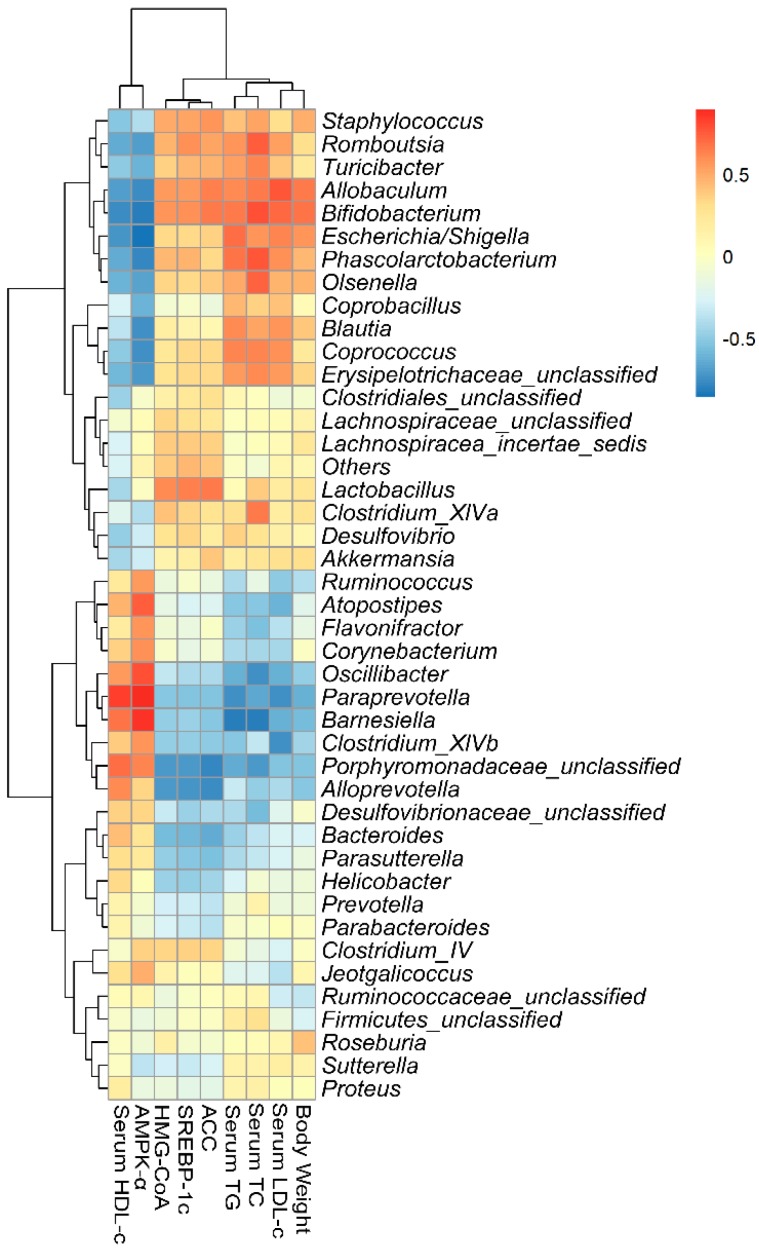
Figure 5.
Statistical Spearman’s correlations between the caecal microbiota of significant differences and lipid metabolic parameters in SPL95, HFD, and NFD groups. The intensity of the color represents the degree of association between caecal microbiota of significant differences and MetS-associated parameters.

