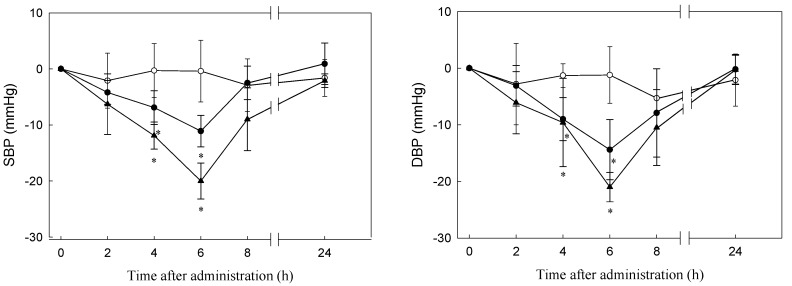
Figure 3.
Changes in blood pressure of SHRs after oral administration of PN-1. (a) SBP; (b) DBP. —O—, 0.9% NaCl in water as control; —●—, 30 mg of C. sorokiniana protein hydrolysate powder with 0.9% NaCl; —▲—, 60 mg of C. sorokiniana protein hydrolysate powder with 0.9% NaCl. Each point represents a mean value (n = 6) and the vertical bars represent the standard errors. *: significant difference from the control, p < 0.05.

