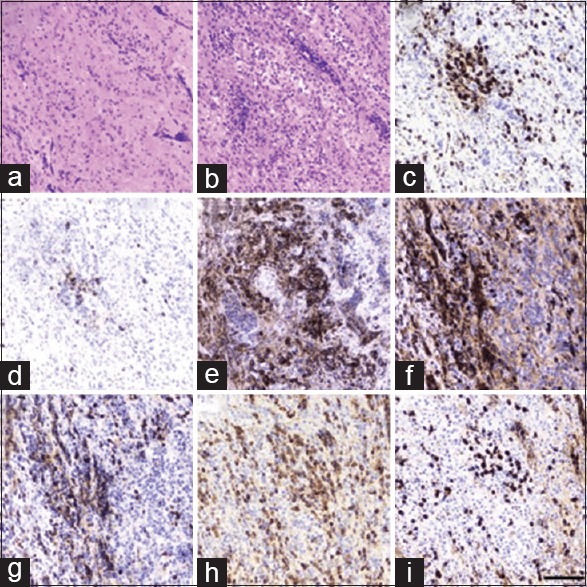
Figure 3.

Histopathology slides. (a) Hematoxylin and eosin showing mixture of inflammation and fibrosis. (b) Hematoxylin and eosin showing areas of more extensive mononuclear inflammation. (c) CD3, numerous T-cells. (d) CD20, relatively fewer B-cells. (e) CD138, heavy plasma cells. (f) Kappa light chain. (g) Lambda light chain. (h) IgG. (i) Scale bar = 50 microns; IgG4
