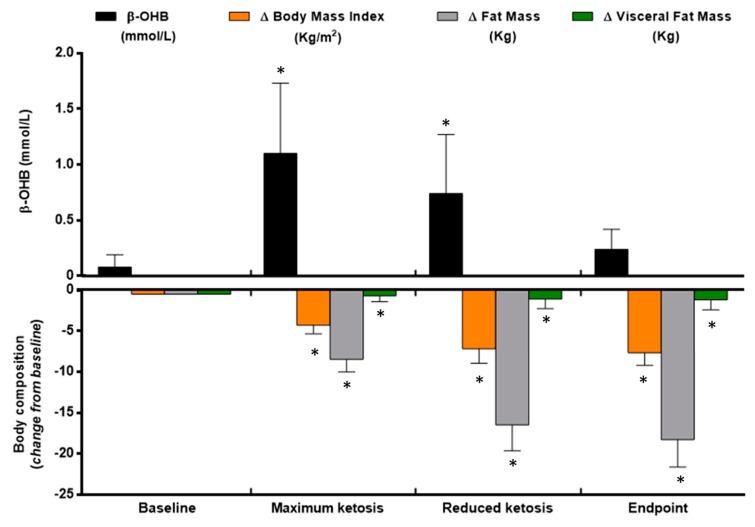
Figure 1.
Ketone bodies and body composition changes during the very low-calorie-ketogenic diet treatment. Data represent mean ± standard error of changes from baseline. (*) Denotes statistically significant differences as compared with baseline. (△) Denotes differences from baseline. β-OHB, β-Hydroxy-Butyrate.

