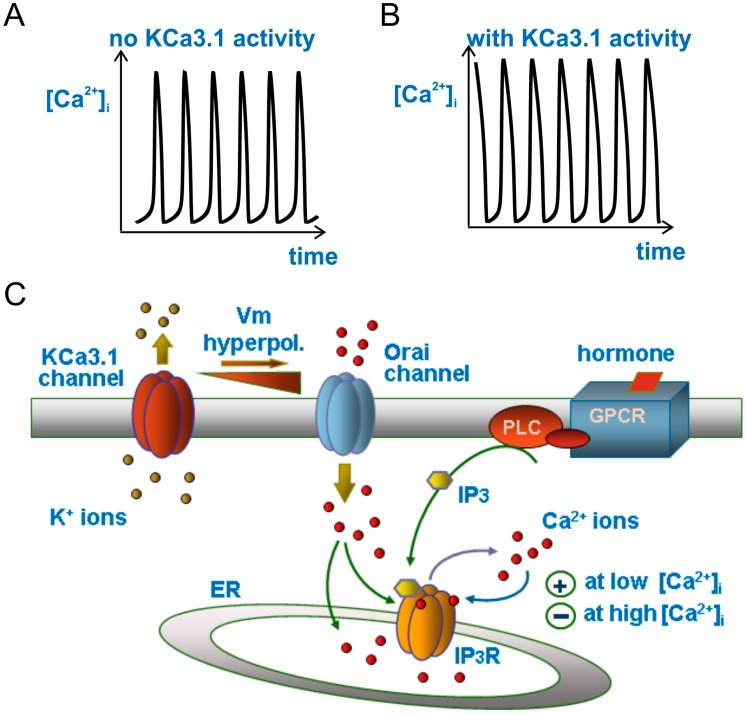
Figure 2.
Modulation of Ca2+ oscillations by the KCa3.1 channel. Drawing (C) illustrating the main ion fluxes generating or modulating the Ca2+ oscillations in our model when the KCa3.1 channel is cut off (A) or introduced into the system (B). Please notice the much longer duration (width) and slightly higher amplitude of the Ca2+ oscillations in the presence of KCa3.1 channels.

