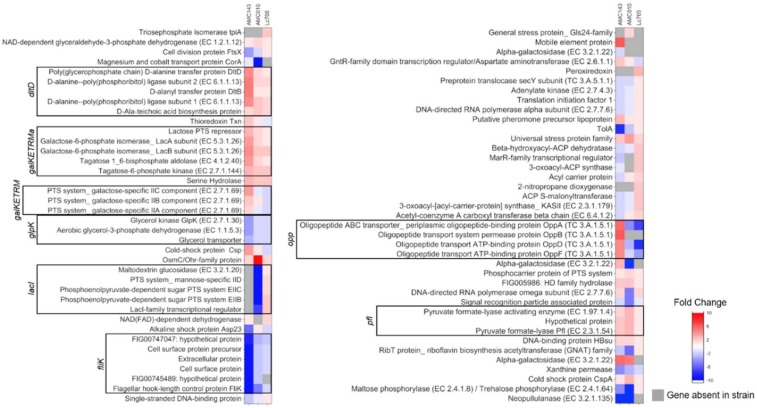
Figure 4.
Transcriptomics analysis. Heat maps for AMC143, AMC010, and Lc705 were generated from sequencing reads mapped to their respective genome sequence and plotted to show fold changes between cultures in glucose compared to GOS. Boxed genes represent potential operons, and grayed genes represent genes absent in the associated strain. Three biological replicates were included in each experiment.

