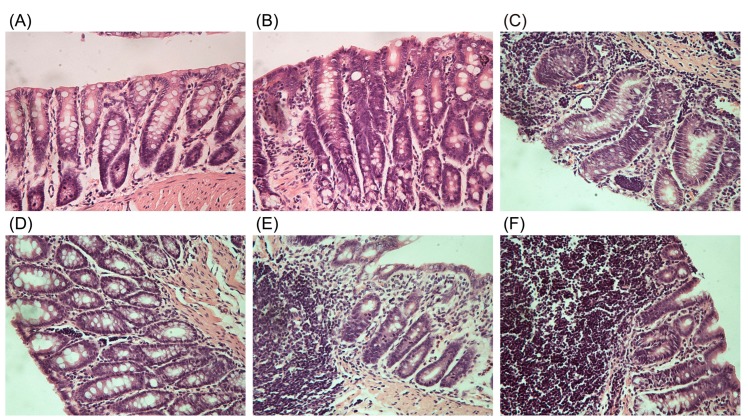
Figure 4.
The H&E staining on the colons collected from the untreated rats and treated rats for over six days (original magnification 40×). (A) The colon from normal control rats (NC). (B) The colon from rats treated with the low dose of senna extract (L-SE). (C) The colon from rats treated with the high dose of senna extract (H-SE). (D) The colon from rats treated with the low dose of sennosides (L-SS). (E) The colon from rats treated with the high dose of sennosides (H-SS). (F) The colon from rats treated with the high dose of sennoside A (SA).

