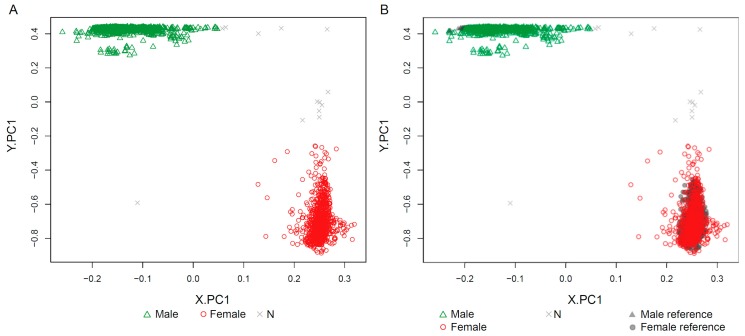
Figure 3.
Plots from ‘plotSexEstimation’. This function plots the first component of PCA.X (X.PC1) against the first component of PCA.Y (Y.PC1). The vast majority of test samples were predicted as either M (2253) or F (1618), but the sex was undetermined for 20 samples, indicated as N. (A) The ‘include_reference’ parameter was set to FALSE to show only test samples. (B) The ‘include_reference’ parameter option was set to TRUE to show reference samples, but they were mostly hidden underneath test samples.

