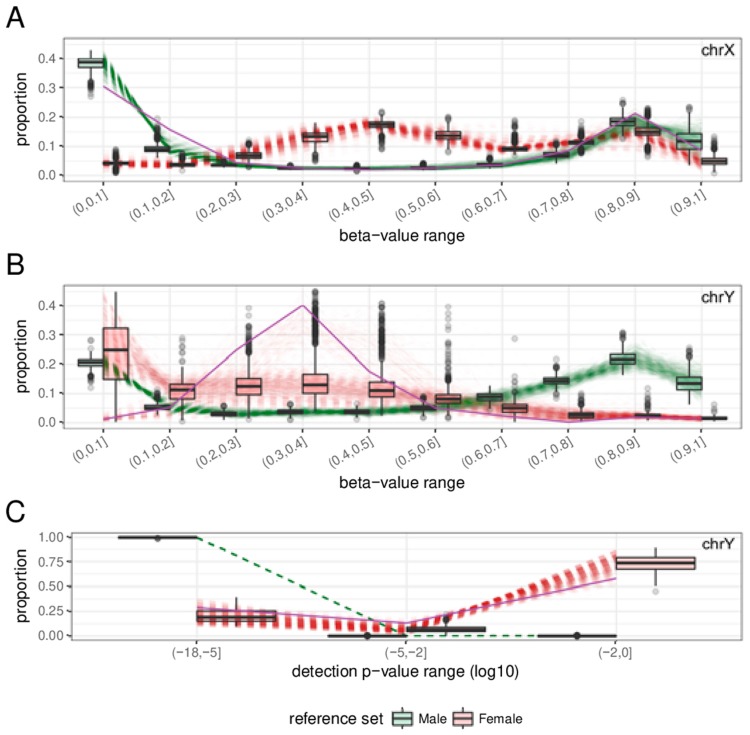
Figure 5.
Beta-value/detection p-value distribution of the Turner syndrome sample. Sample GSM1572595, shown in purple, exhibits a male-like pattern for chrX (A) and a female-like pattern for chrY (B,C). Dashed green and red blurred lines show the profiles of reference samples.

