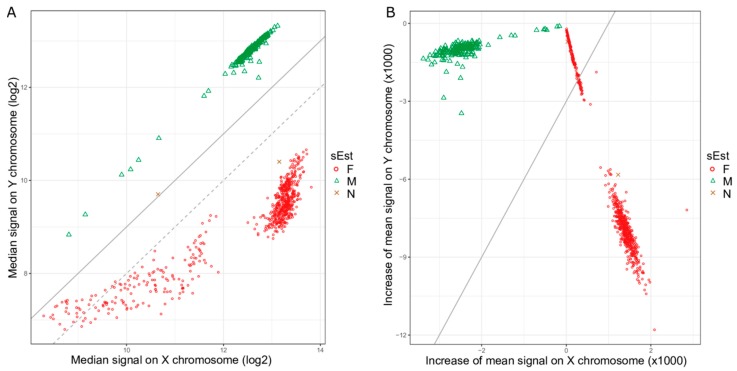
Figure 6.
Signal intensity plots for dataset GSE51032. (A) The median signal intensity of chrX probes (xMed) against the median signal intensity of chrY probes (yMed) in log2-scale for each sample. The grey dotted line indicates the default cut-off of −2 for the difference between xMed and yMed (yMed−xMed) that the ‘getSex’ function of minfi package uses. A lot of red circles are above this line and are classified as Male by the ‘getSex’ function using the default parameters. Changing the cut-off to −1 (grey solid line) would reclassify the red circles above the grey dotted line as Female. (B) Increase in mean signal intensity on chrX and chrY compared to mean signal intensity on all autosomes. The grey solid line represents the cut-off line, which passed through a cluster of female samples, resulting in a large number of misclassified samples.

