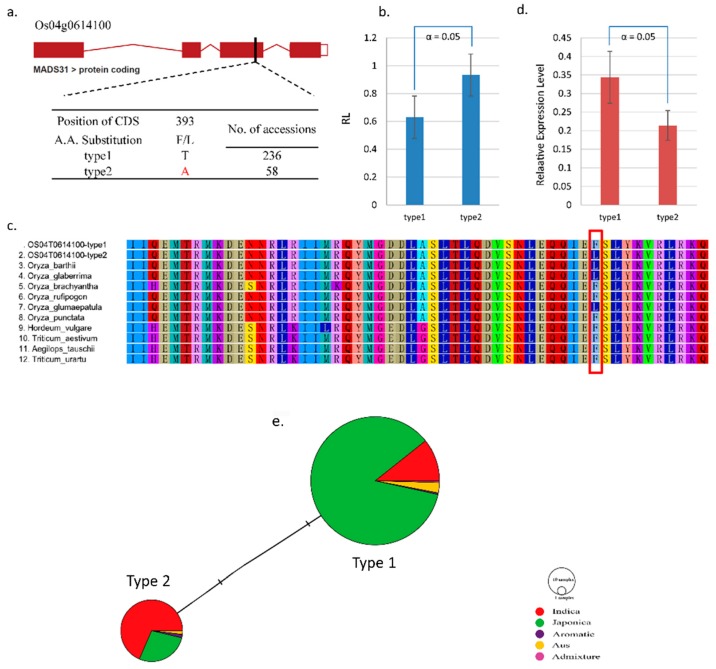
Figure 4.
Haplotyping and sequence analysis of Os04g0614100, which was correlated with a phenotypic difference. (a) One functional SNP of the candidate gene in the CDS region. Type 1 is the reference and type 2 is the SNP. (b) The phenotypic difference based of the functional SNP. (c) Amino acid sequence alignment using several orthologues in various rice subgroups and species. Red box indicates the target amino acid change caused by the functional SNP. (d) RNA expression levels in rice accessions with type 1 and type 2. (e) Haplotype network analysis. Circle size is proportional to the number of samples within a given haplotype. Lines between haplotypes represent mutational steps between alleles. Colors denote rice designation.

