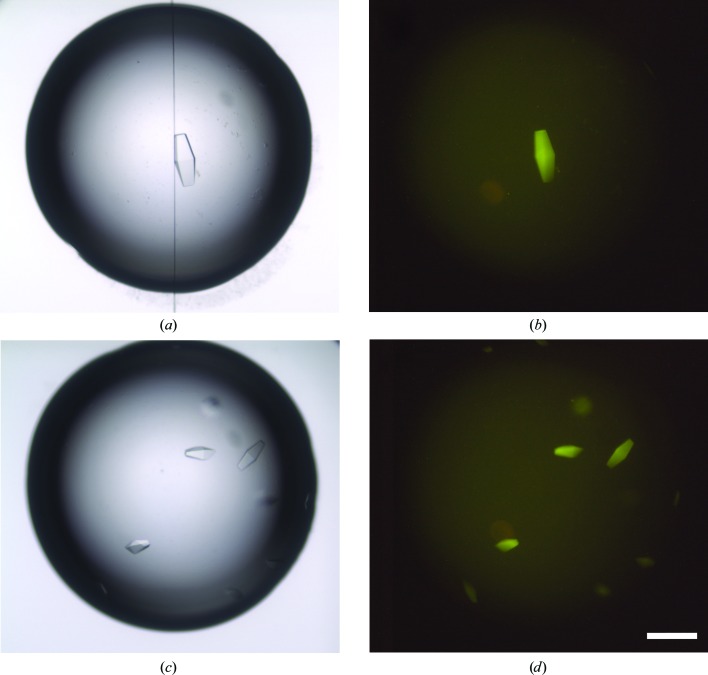
Figure 3.
Detection of PhaCCA crystals by TFL. Crystals were grown in sitting drops from a sample containing 0.6% labeled protein mixed with a solution consisting of 100 mM sodium acetate, 1 M diammonium hydrogen phosphate pH 4.5 (the scale bar is 0.2 mm in length). The images in (a) and (c) were obtained with white-light illumination. The images in (b) and (d) were obtained with a 520 nm light source and a low-pass filter at 550 nm (LP550).

