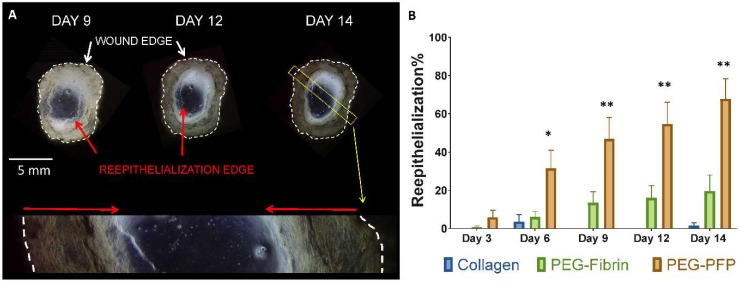
Figure 4.
Re-epithelialization of ex vivo explants. (A) Representative microscopy images of a PEG-PFP treated wound that were captured over the time course and stitched together to create the above entire view of the ‘wound’. The white dotted lines represent the edges of the actual wound created by the biopsy punch. The red arrows are pointing to the leading edge of the newly formed epidermis. Light does not pass through the full thickness tissue and is reflected by the black regions around each wound. The bottom is an enlarged view of the yellow dotted rectangle from the day 14 image. The newly formed epidermis is highlighted by the red arrows indicating how much has been re-epithelialized by day 14. (B) Percent wound closure was quantified for all explants over the time course by measuring the total wound area and the area enclosed by the leading edge of the neo-epidermis. PEG-PFP was significantly different from all other treatment groups. * p < 0.01; ** p < 0.001, N = 5.

