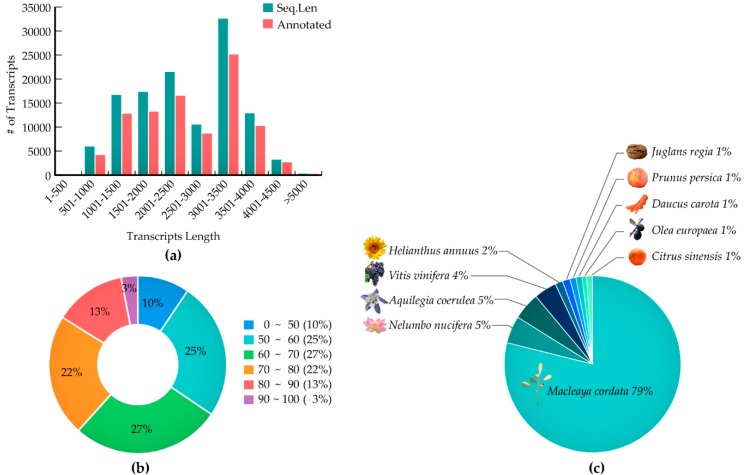
Figure 1.
Illustration of the transcriptome assembly and functional annotation summary; (a) length distribution of assembled transcripts with and without annotations; (b) distribution of BLAST similarities; and, (c) species distribution from the BLAST outputs (all the images used in this figure are released free of copyright under the Creative Commons CCO license).

