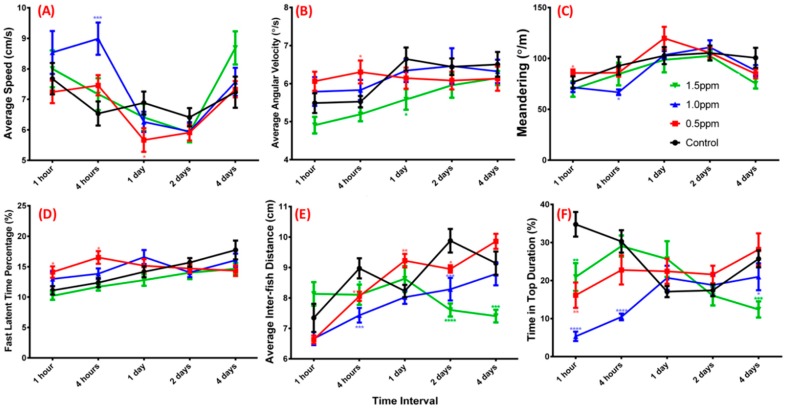
Figure 2.
Three-dimensional (3D) locomotor activity assay for ZnCl2-treated zebrafish. (A) Average speed; (B) average angular velocity; (C) meandering; (D) fast latent time; (E) total distance traveled by treated and control groups; (F) time spent at top of the tank by adult fish within five different time intervals (n = 18 for each testing concentration). Black line, control; red line, 0.5 ppm ZnCl2 exposure; blue line, 1.0 ppm ZnCl2 exposure; green line, 1.5 ppm ZnCl2 exposure. Locomotor activity was compared to control at each time point using a t-test (* p ≤ 0.05; ** p ≤ 0.01; *** p ≤ 0.001; **** p ≤ 0.0001).

