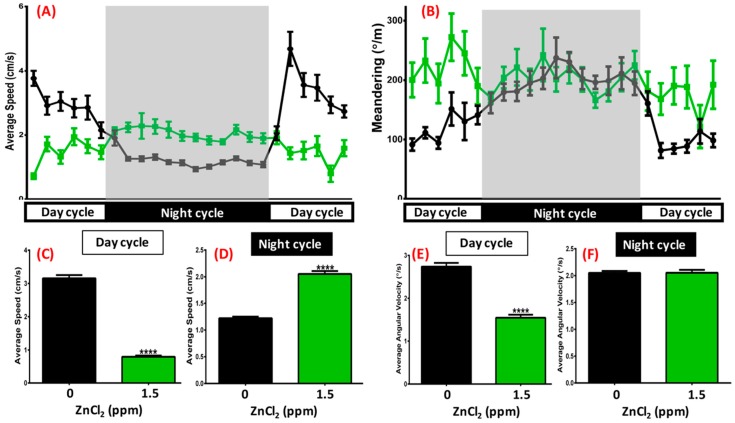
Figure 6.
Circadian rhythm test after 21-day exposure. (A) Average speed and (B) meandering of 1.5 ppm ZnCl2-treated (green line) and control fish (black line) during day/night cycle. The gray area shows the dark period and the unshaded area shows the light period. Eighteen fish were observed for both the control and ZnCl2-treated groups. Quantitative comparison of average speed during (C) day cycle and (D) night cycle. Quantitative comparison of average angular velocity during (E) day cycle and (F) night cycle. Data are presented as means ± SEM (**** p ≤ 0.0001).

