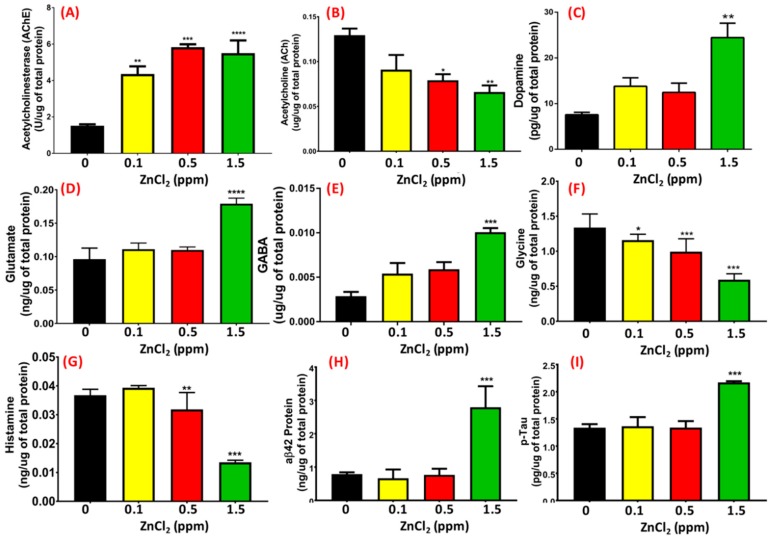
Figure 8.
Detection of neurotransmitter levels in the brain. (A) Acetylcholinesterase, (B) acetylcholine, (C) dopamine, (D) glutamate, (E) gamma-aminobutyric acid (GABA), (F) glycine, (G) histamine, (H) amyloid beta 42 (aβ42), and (I) phosphorylated (p)-Tau levels in the brain were measured using ELISA. Data are represented as means ± SEM. Statistical analysis was compared to control using a t-test (* p ≤ 0.05; ** p ≤ 0.01; *** p ≤ 0.001; **** p ≤ 0.0001).

