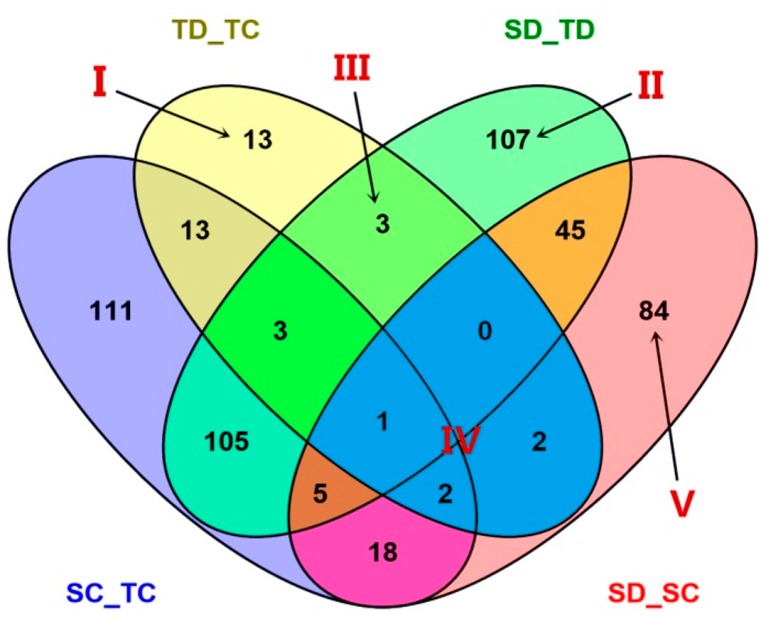
Figure 3.
Venn diagram analysis of differentially abundant proteins (DAPs) identified in the four experimental comparisons. The overlapping regions of the Venns indicate the DAPs shared between/among corresponding groups. Area I represents 13 drought responsive DAPs specific to TD_TC; Area II represents 107 DAPs exclusive to SD_TD; Area III shows the 3 DAPs specifically shared between TD_TC and SD_TD; Area IV shows the five overlapping DAPs within line (shared between TD_TC and SD_SC); Area V shows 84 DAPs exclusive to SD_SC comparison.

