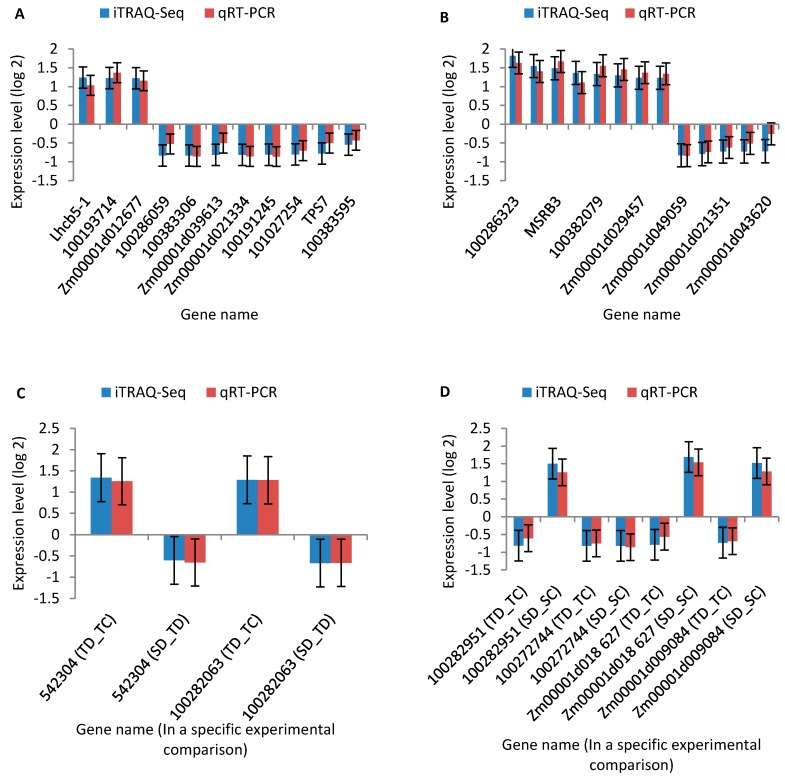
Figure 8.
Confirmation of iTRAQ-seq results by quantitative real-time PCR (qRT-PCR). Quantitative RT-PCR analysis of the expression patterns of the maize seedling leaf genes encoded by differentially abundant proteins (DAPs) from different comparisons: (A) DAPs specific to TD_TC; (B) DAPs specific to SD_TD; (C) DAPs shared between TD_TC and SD_TD; and (D) Common DAPs shared between TD_TC and SD_SC. The y-axis represents qPCR relative expression levels (log2-fold change) and fold-change of the iTRAQ-seq data. All genes with negative values of expression level means that they were down-regulated in response to drought stress. Maize gene GAPDH (accession no. X07156) was used as the internal reference. Error bars represent the SE (n = 3).

