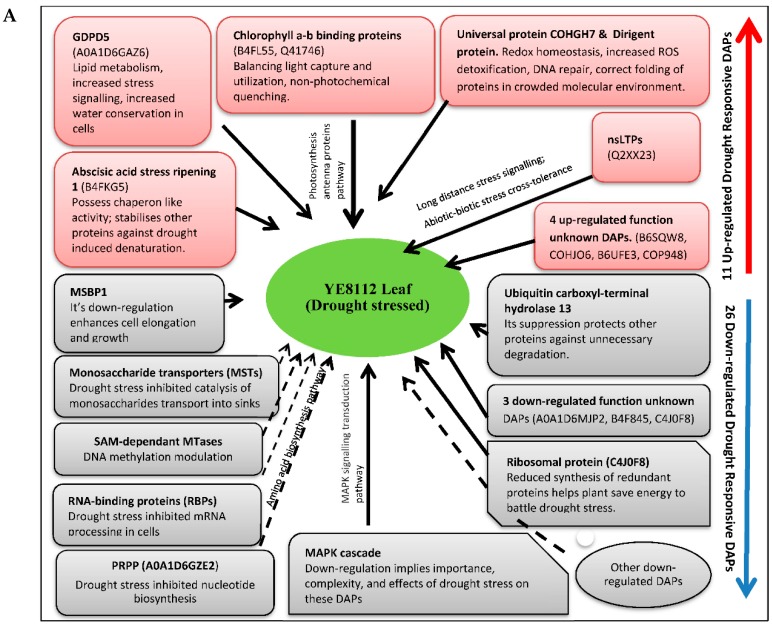
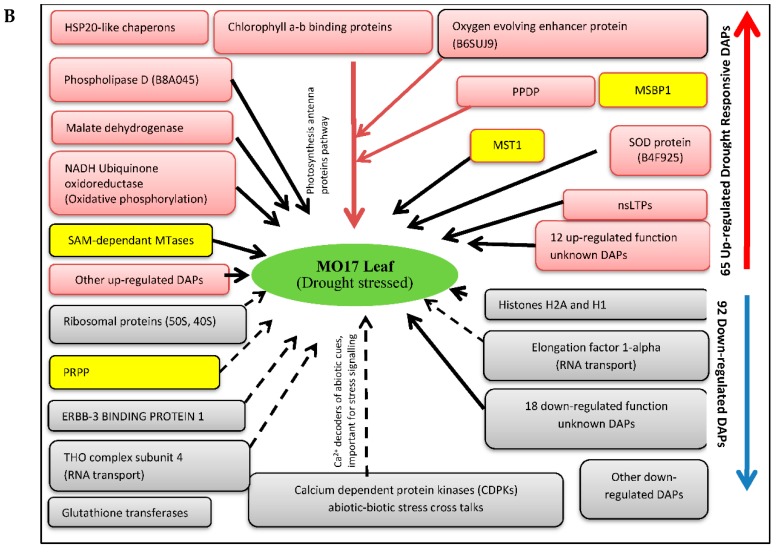
Figure 9.
Molecular models of drought tolerance in maize seedling leaves of: (A) tolerant inbred line YE8112 and (B) sensitive line MO17. Red nodes (rectangles/circles) signify up-regulated DAPs; gray nodes signify down-regulated DAPs; yellow nodes in MO17 model (Figure 9B) represents overlapping DAPs also observed in YE8112. Dotted black connectors/arrows imply drought stress imposed negative effects on respective proteins or pathways; compound type black connectors imply desirable drought stress response outcomes on respective proteins. Note: nsLTPs, non-specific lipid transfer proteins; GDPD5, Glycerophosphodiester phosphodiesterase 5; MSBP1, membrane steroid binding protein 1; MAPK, mitogen-activated protein kinases; PRPP, Ribose-phosphate pyrophosphokinase; MST1, monosaccharide transporter 1; PPDP, pyruvate phosphate dikinase proteins.


