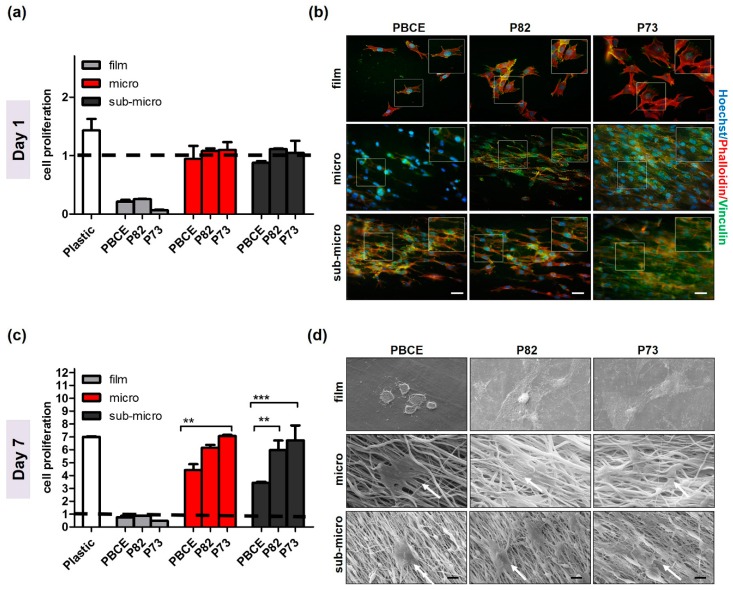
Figure 3.
C2C12 proliferation and morphology on microfibrous and sub-microfibrous PBCE and P(BCE-co-TECE) scaffolds. (a,c) Cell growth evaluation was performed using the CCK8 assay at day 1 (a) and 7 (c) of culture. Cell proliferation (fold increase) is plotted as the ratio between number of cells at each time and number of cells seeded (1.0 × 10⁵ cells/scaffold) on day 0 (indicated by dashed line); ** p < 0.01; *** p < 0.001. (b) Expression of focal adhesion protein vinculin (green). The cytoskeleton organisation was observed by F-actin staining with Phalloydin (red). Nuclei were stained with Hoechst 33342 (blue). Magnified areas of cells are shown in insets. Scale bars = 50 μm. (d) Representative scanning electron microscopic images of the cells cultured on PBCE, P82, and P73 materials. Scale bars: 10 µm. White arrows are positioned to indicate C2C12 cells.

