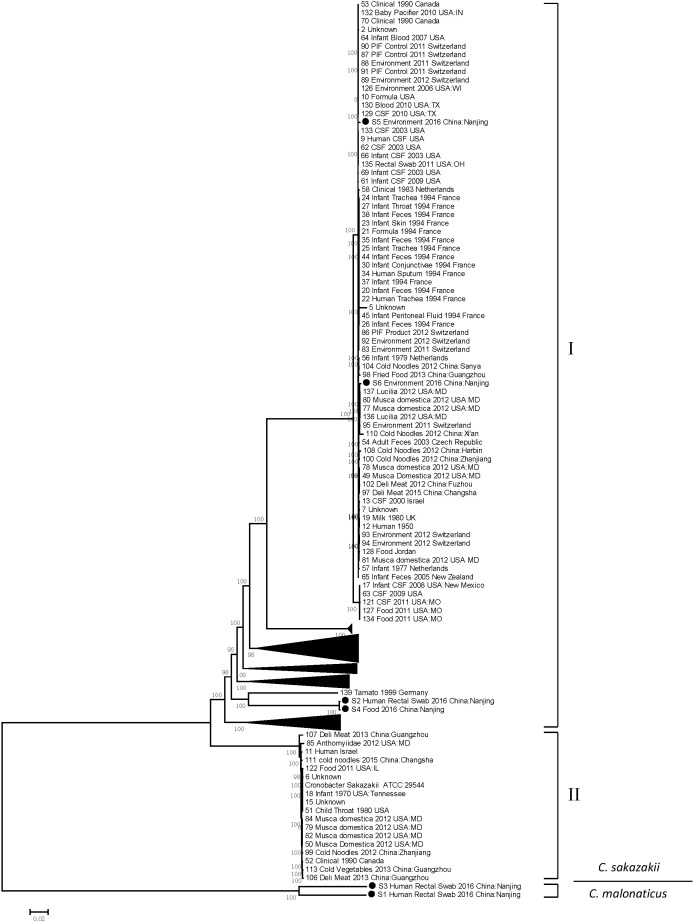
FIGURE 3.
Maximum likelihood phylogenetic tree based on single nucleotide polymorphism (SNP) analysis of the present six Cronobacter isolates and comparison sequences. Black solid circles (∙) indicate the Cronobacter isolates in this study. Numbers along branches are bootstrap values. Scale bar indicates estimated evolutionary distance.

