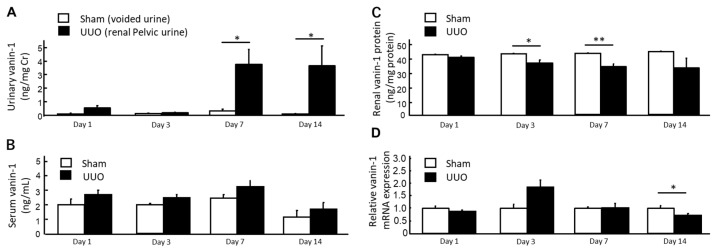
Figure 3.
Accumulation of vanin-1 in the renal pelvic urine of rats with UUO. (A,B) Released vanin-1 was detected in the renal pelvic urine, but not in the serum, on days 7 and 14 after UUO (n = 5 for each time point in each group). Data represent the mean + SE. * p < 0.05 vs. the sham-operated rats (by one-way ANOVA followed by Tukey’s post hoc analysis). (C,D) Vanin-1 protein and mRNA expressions in the renal cortices of the obstructed kidney (UUO, n = 5 per time point) were decreased compared with those of sham-operated kidney (Sham, n = 5 per time point). Data represent the mean + SE. * p < 0.05 and ** p < 0.01 vs. the sham-operated rats (by one-way ANOVA followed by Tukey’s post hoc analysis).

