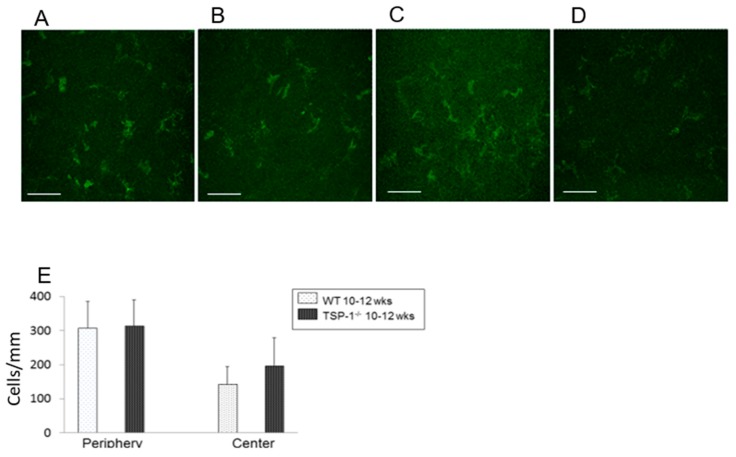
Figure 3.
Comparison of the number of monocytes in WT and TSP-1−/− mouse corneas through analysis of CD11b+ cells (E). CD11b+ cells were present in young WT peripheral areas (A), young WT central areas (B), young TSP-1−/− peripheral areas (C), and young central areas (D). The number of cells/mm was analyzed for each condition and are presented in (E). n = 3. Scale bar represents 50 μm.

