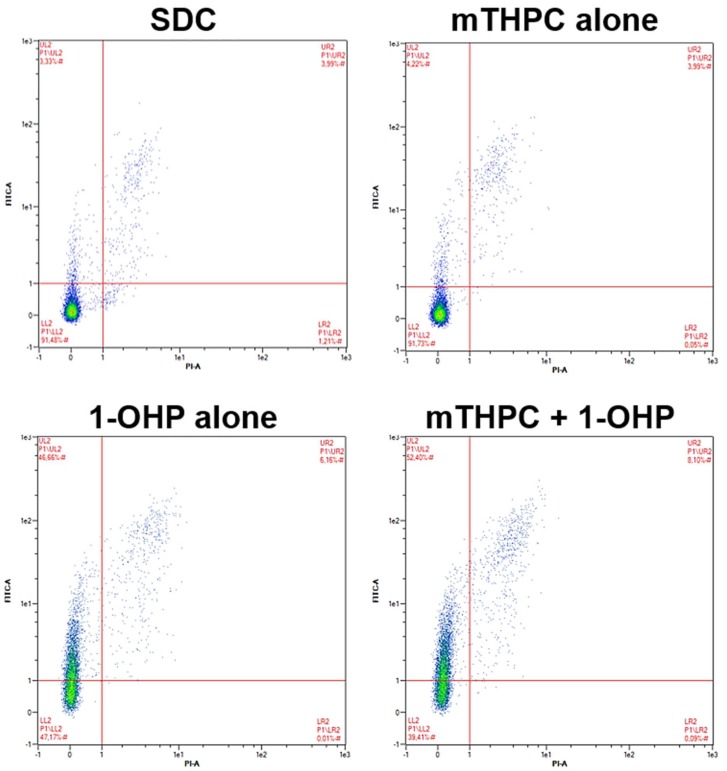
Figure A3.
Representative dot plots after flow cytometric analysis of apoptosis induction in SISO cells. Cells were treated with a solvent dark control (SDC), mTHPC or 1-OHP alone, or a combination of mTHPC and 1-OHP prior to illumination with 1.8 J/cm2. Double staining with Annexin V-FITC and propidium iodide (PI) was carried out 48 h after illumination. For each sample, 10,000 events were counted and gated for the single cell population (not shown). Unstained, vital cells appear in the lower left quadrant, Annexin V-FITC-positive (apoptotic) cells in the upper left quadrant and Annexin V-FITC- and PI-positive (late-apoptotic/necrotic) cells appear in the upper right part. The B1 channel (λEx/Em = 488 nm/525–550 nm) of a MACS Quant flow cytometer was used for the detection of Annexin V-FITC and the B3 channel (λEx/Em = 488 nm/655–730 nm) was used for the PI signal. Data were analysed with the MACS Quantify Software.

