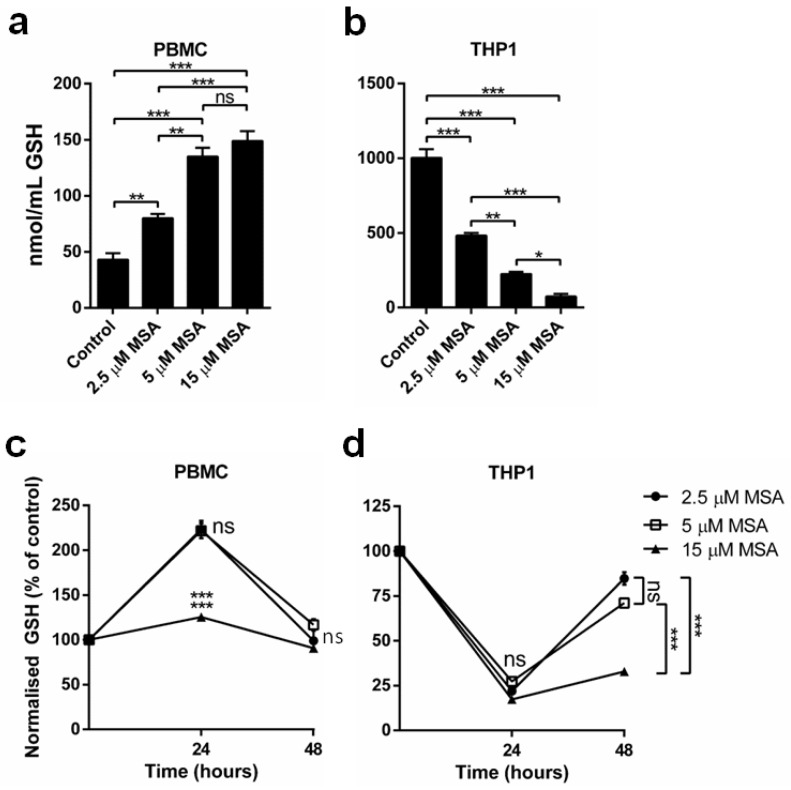
Figure 2.
MSA has divergent impact on glutathione (GSH) levels in normal and malignant cells. (a,b) GSH quantification in PBMC and THP1 cells demonstrates that MSA significantly reduces GSH levels in THP1 cells and significantly increases GSH levels in PBMCs after 6 h (n = 5, ± SEM); (c,d) Timeline of GSH levels in PBMCs and THP1 cells after MSA treatments demonstrates GSH alterations are maintained for up to 24 h. n = 3, ± SEM, * p < 0.05, ** p < 0.01, *** p < 0.001, ns, not significant.

