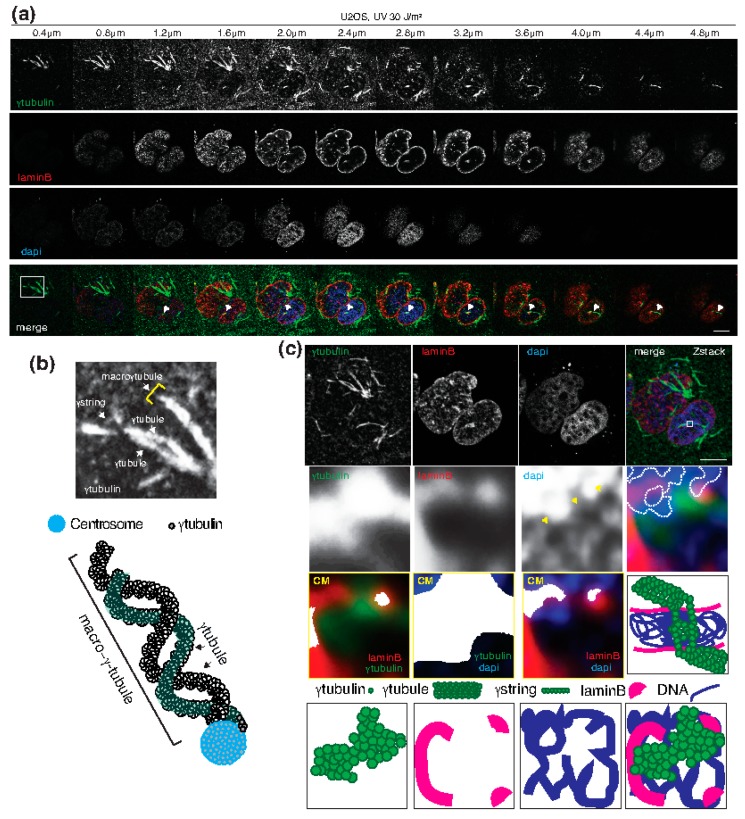
Figure 3.
Connecting both sides of the cytoplasm with the nuclear compartment. (a–c) U2OS cells were treated with 30 J/m2 UV light and incubated for 5 minutes before fixation. Endogenous γ-tubulin and lamin B were detected by confocal immunofluorescence microscopy (Zeiss LSM 700 Axio Observer microscope with a Plan-Apochromat 63× NA 1.40 oil immersion objective) using an anti-γ-tubulin and an anti-lamin B antibody. Nuclei were detected with 4′,6-diamidino-2-phenylindole, dihydrochloride (DAPI) [48]. (a) Sequential fluorescence Z-stack images showing the γ-tubulin meshwork, the lamina (laminB), and chromatin. White arrowheads follow two γ-tubules that meet in the nuclear compartment. The images were collected at 0.4 μm intervals. The white box indicates the area magnified in the micrograph in panel (b). (b) The magnified area (micrograph) and a cartoon depicting two γ-tubules that produce a macro-γ-tubule by nucleating on a centrosome. The γ-tubulin molecules form strings (γ-strings) and γ-tubules. (c) Z-stack showing average intensity projection of the collected images in panel (a). The white box indicates the area magnified in the inset. Dense chromatin domains in the inset are designated with a dashed borderline and yellow arrowheads show less dense chromatin domains. Yellow boxes represent colocalized pixel maps (CM) of the indicated channels of the areas magnified in the inset. White areas in the maps denote pixels colocalized between channels [13]. Black boxes are schematic representations of the structures shown in the fluorescence images. The images in (a–c) are representative of at least six experiments. Scale bars: 10 μm.

