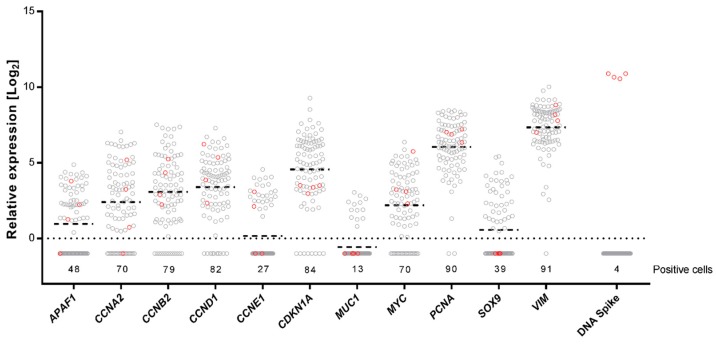
Figure 4.
Single-cell gene expression profiling, where 92 single cells were treated with Cod uracil-DNA N-glycosylase (Cod UNG) in presence of 100 copies of an artificial uracil-containing DNA spike followed by preamplification using dUTP. The relative expression is shown for each gene where individual cells are represented by circles. The number of cells expressing each gene is indicated. Horizontal bars indicate mean expressions; the dotted line indicates one molecule. Four of the 92 cells were treated with heat inactivated Cod UNG (red), while the remaining 88 cells were treated with active Cod UNG (grey).

