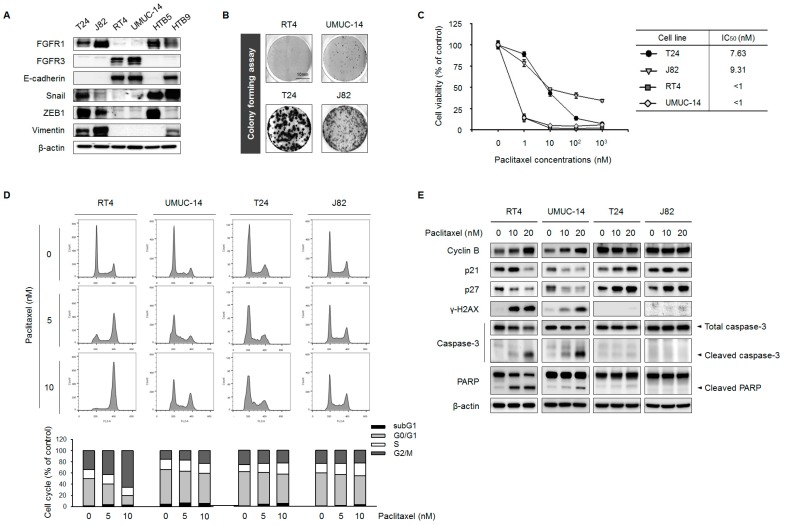
Figure 1.
FGFR1 expression is correlated with EMT features and PTX resistance in UC cell lines. (A) T24, J82, RT4, UMUC-14, HTB5, and HTB9 cells were evaluated basal expression of FGFRs and EMT-associated proteins by Western blotting; β-actin served as a loading control. (B) Colony formation assay. T24, J82, RT4, and UMUC-14 cells were grown for 7 days, then stained with Coomassie Brilliant Blue and counted. (C) T24, J82, RT4, and UMUC-14 cells were treated with 0, 1, 10, 100, and 1000 nM PTX for 3 days. IC50 values were calculated using CalcuSyn (BioSoft, Ferguson, MO, USA). Data represent the mean ± standard deviation of five replicates. (D) Cell cycle analysis by propidium iodide staining and flow cytometry. A total of 1 × 10⁶ cells were seeded in 60-mm plates and treated with 0, 5, and 10 nM PTX for 48 h. Data are presented as histograms (blue, G0/G1 phase; green, S phase, and red, G2/M phase). (E) Cyclin B, p21, p27, γ-H2AX, caspase-3, and PARP expression in T24, J82, UMUC-14, and RT4 cells, as determined by Western blotting; β-actin served as the loading control.

