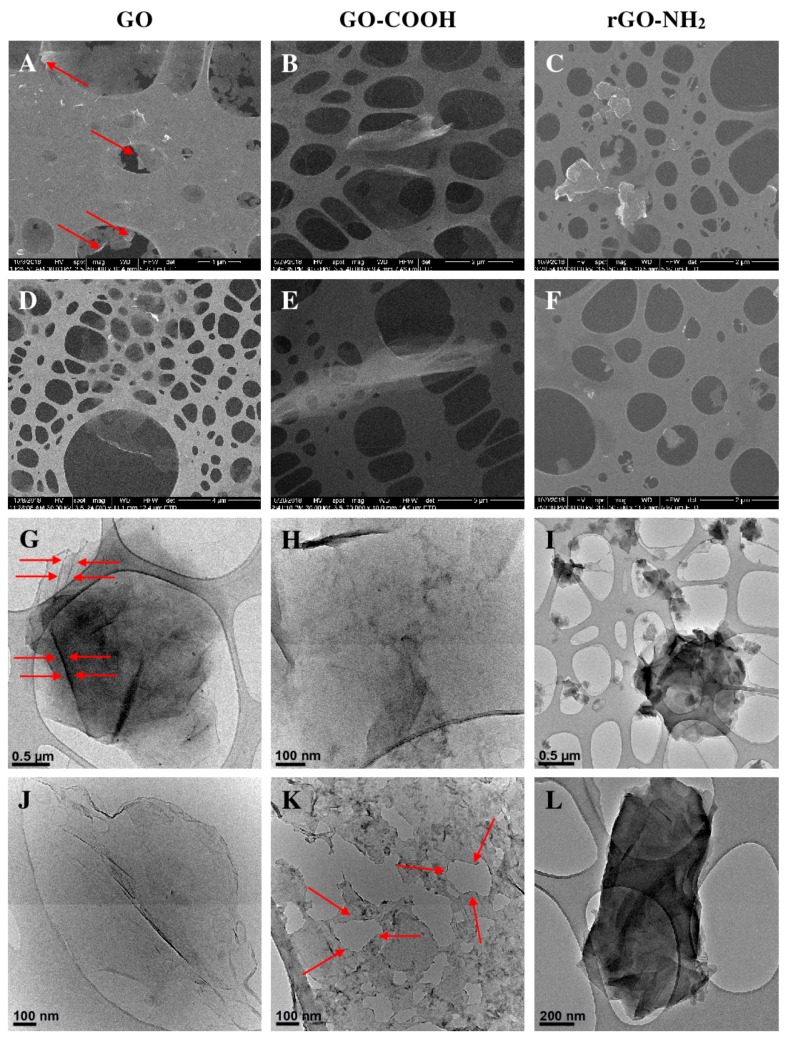
Figure 4.
The impact of ultrasound treatment duration on GO, GO-COOH and rGO-PEG-NH2 as seen through scanning electron microscopy (SEM) (A–F) and TEM (G–L) images. Morpho-structural alterations induced by 1 h sonication are depicted in panel (A) (red arrows: incipient edge peeling) and (G) (red arrows: structural folding wrinkled surface) for GO, (B,H) for GO-COOH, (C,I) for and rGO-PEG-NH2, whereas panels (D,J) correspond to GO, (E,K) (red arrows: layer cleavage) to GO-COOH, (F,L) to rGO-PEG-NH2 after 2 h sonication.

