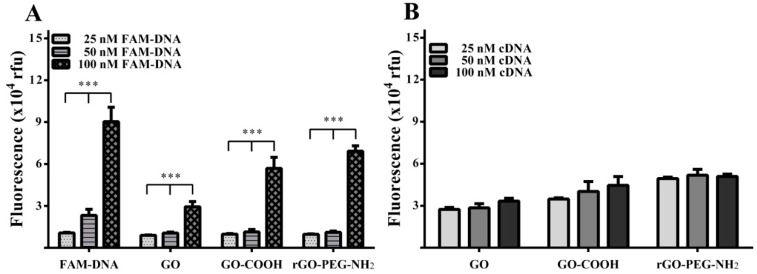
Figure 5.
Fluorescence values for different FAM-DNA probe concentrations and three diverse graphenic nanomaterials (10 μg/mL). (A) Fluorescence intensity of different increasing FAM-DNA probe concentrations in the presence of distilled water, GO, GO-COOH, and rGO-PEG-NH2. (B) Fluorescence of FAM-DNA probe (100 nM) and graphenic material (10 μg/mL) with addition of increasing concentrations of target cDNA. Error bars represent means ± standard deviation (SD) of n = 3. *** p < 0.001.

