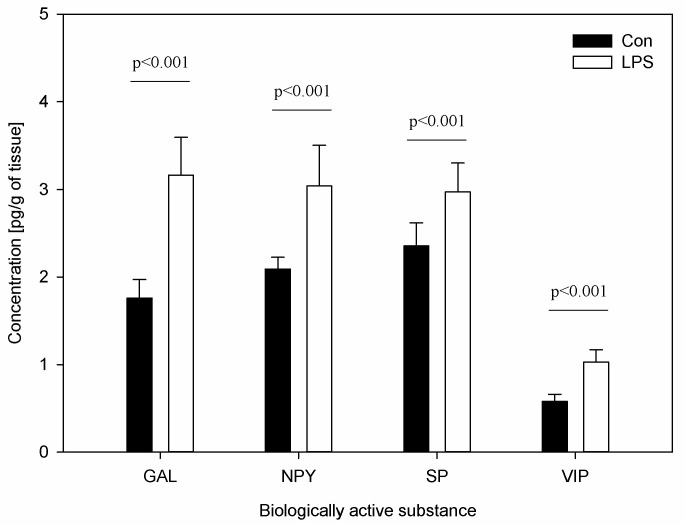
Figure 5.
Concentrations of neuropeptides: galanin (GAL), neuropeptide Y (NPY), substance P (SP), and vasoactive intestinal peptide (VIP) in the superficial cervical lymph nodes (scLN). Bars represent mean ± SD (standard deviation); n = 5 pigs/group; Con—the control group, which received saline; LPS—the treatment group, which received LPS from S. Enteritidis at a dose of 5 μg/kg b.w. (in saline solution). The statistical analysis was performed by one-way ANOVA and Tukey’s tests. The results were statistically different at p < 0.001 as compared with the control group.

