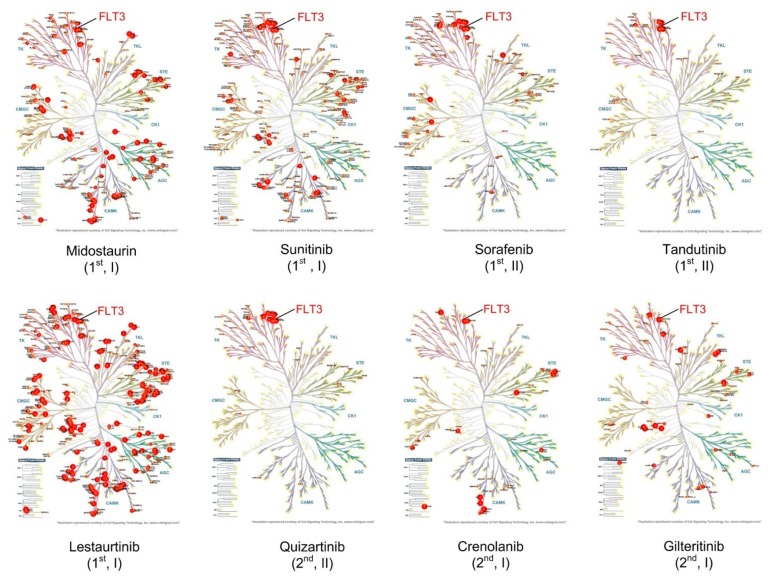
Figure 3.
Kinase targets of first- and second-generation FLT3 inhibitors. Kinase trees depicting the dissociation constant (Kd, (nM)) of the target kinases of each inhibitor. Size of red bubble is proportional to the Kd value, with a larger bubble indicating a lower Kd. First generation inhibitors = 1st, second generation inhibitors = 2nd. Brackets indicate whether the inhibitor is type I or type II. Illustrations reproduced Courtesy of Cell Signaling Technology, created using KinMap [138], with data from references [139,140,141].

