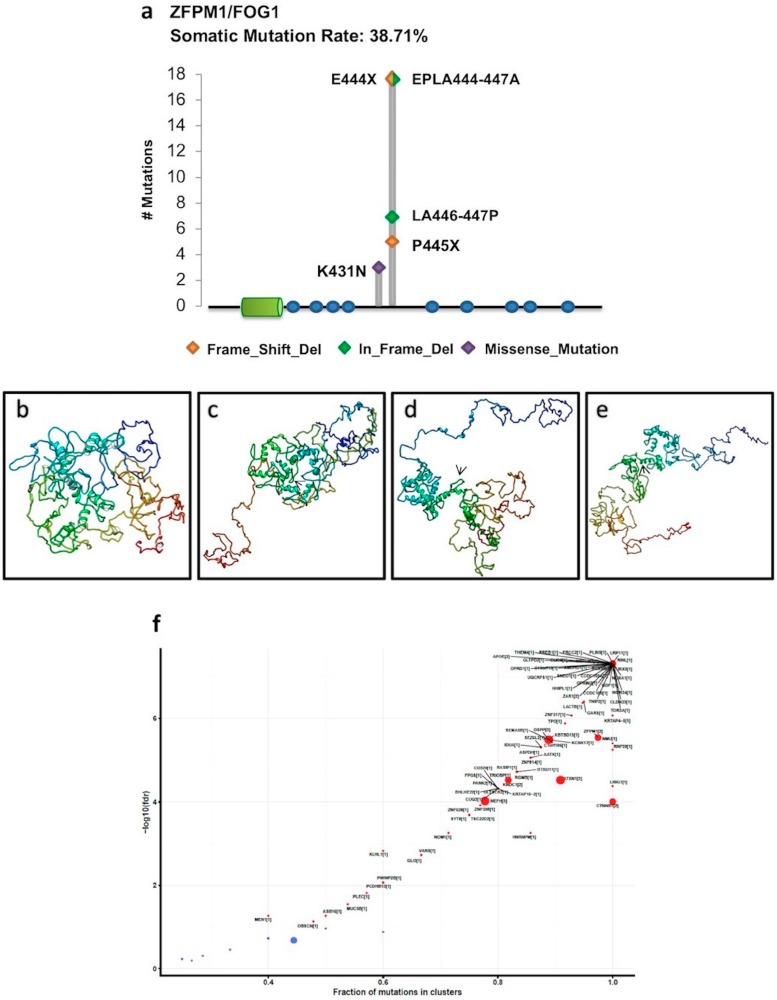
Figure 4.
(a) ZFPM1/FOG1 hotspot mutations in ACC obtained by Lollipop plot visualization function. These hotspot mutations are all localized outside the PR domain (green cylinder) and Zinc fingers (blue dots) (b–e) I-TASSER predicted tertiary structures of the annotated ZFPM1/FOG1 canonical protein (b) and ZFPM1/FOG1 proteins carrying the mutations ELPA444-447A (c), LA446-447P (d), and K431N (e); the arrows show the mutated protein regions. (f) The scatter plot shows the results of the OncodriveCLUST algorithm analysis for ACC. The dimension of the dots is proportional to the number of clusters found in a certain gene, also indicated in the squared bracket. Specifically, in the ZFPM1/FOG1 locus, two mutation clusters were found (fdr < 2.87 × 10⁻⁶).

