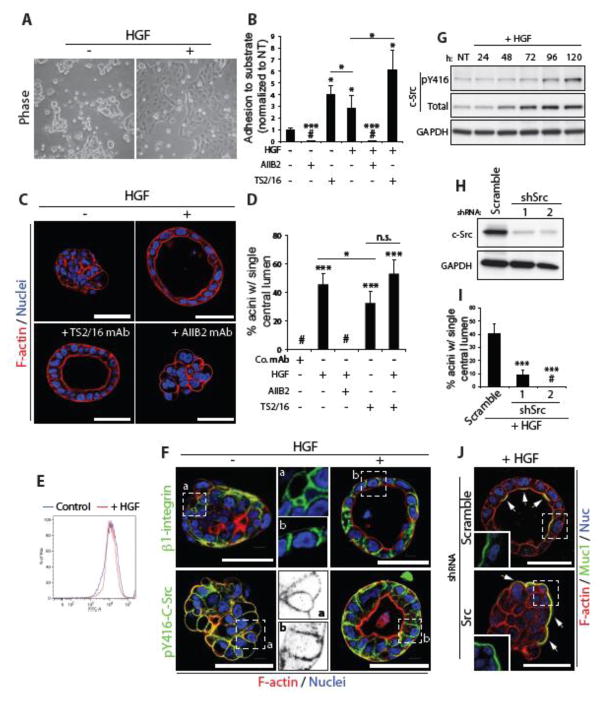
Figure 3. c-Src is a major target of HGF signalling in acinar morphogenesis.
(A) Phase images of Calu-3 cells grown on plastic in presence or absence of HGF.
(B) Graph shows the relative adhesion of Calu-3 cells adhering to laminin-1 after treatment with HGF and either AIIB2, a β1 integrin blocking antibody (1:200), or TS2/16, a β1 integrin activating antibody (1:100), all normalized to non-treated control cells (NT).
(C) Control aggregates or aggregates treated with HGF, with TS2/16 or with HGF and AIIB2, were fixed and stained with F-actin (red) and Hoechst (blue).
(D) Graph shows the percentage of acini with a single central lumen upon treatment with either control antibody (Co. mAb), HGF, AIIB2 or TS2/16.
(E) Surface expression of β1-integrin in control and HGF treated Calu-3 cells in 2D was examined by FACS analysis.
(F) Untreated aggregates or HGF-treated acini were fixed and stained with anti-β1 integrin (green in upper panels) or anti-pY416-c-Src (green in lower panels) antibodies and F-actin (red) and Hoechst (blue). A magnified image of anti-β1 integrin (upper middle panels) and anti-pY416-c-Src (lower middle panels) in untreated and HGF treated samples is also shown (a and b respectively).
(G) Aggregates were stimulated with HGF and harvested at various time-points. Immunoblotting was performed using anti-pY416-c-Src, anti-c-Src and anti-GAPDH antibodies.
(H) c-Src protein expression was reduced in Calu-3 cells using either of 2 different shRNAs and knockdown confirmed by immunoblotting with anti-c-Src and anti-GAPDH antibodies.
(I) Graph shows the percentage of acini with a single central lumen after either control of c-Src knockdown and upon HGF stimulation.
(J) Aggregates expressing Scramble or c-Src shRNA were stimulated with HGF, fixed and stained with anti-Muc1 antibody (green), F-actin (red) and Hoechst (blue). Arrows indicate localization of Muc1 at membranes. Insets show magnified images of Muc1 localization (green).
Graphs (except 3B) are presented as mean percentage +/− s.d. and significance is *p≤0.05 and ***p≤0.0001 (n= 3). All scale bars, 50 μm.

